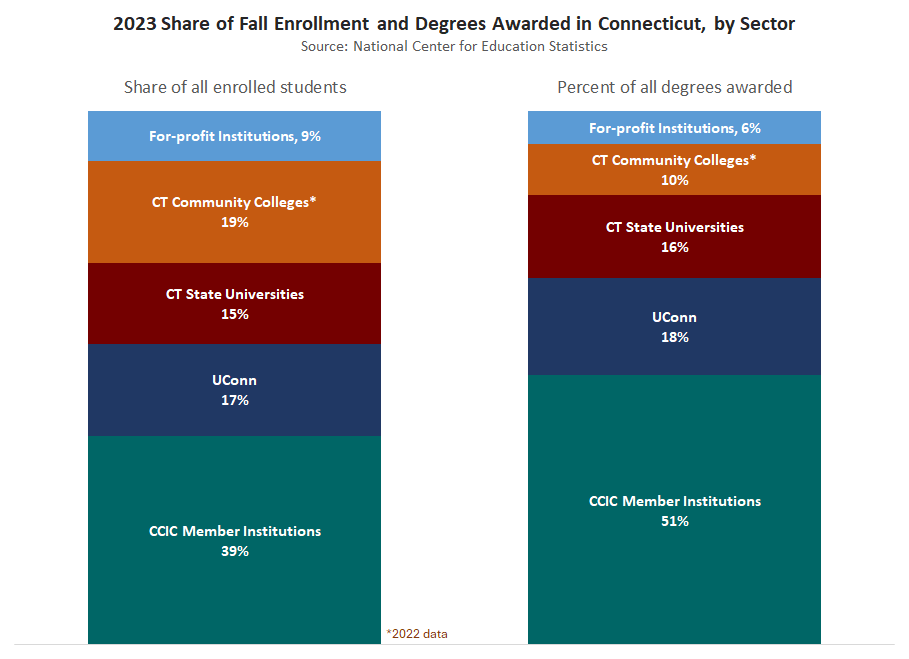
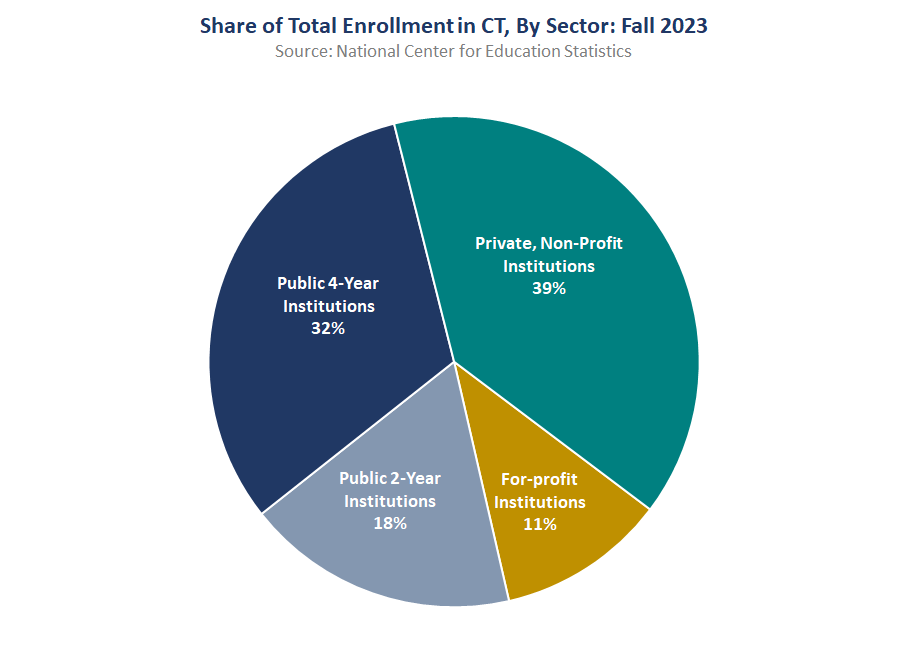
2023 Share of Enrollment and Degrees Awarded in CT, by Sector
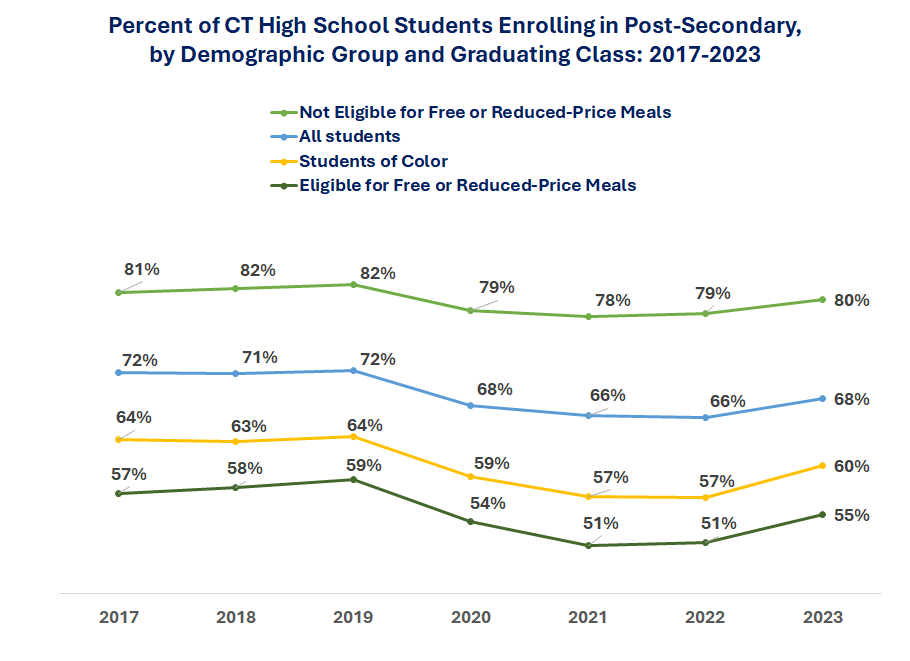
Percent of CT High School Students Enrolling in Post-Secondary, by Demographic Group and Graduating Class: 2017-2023
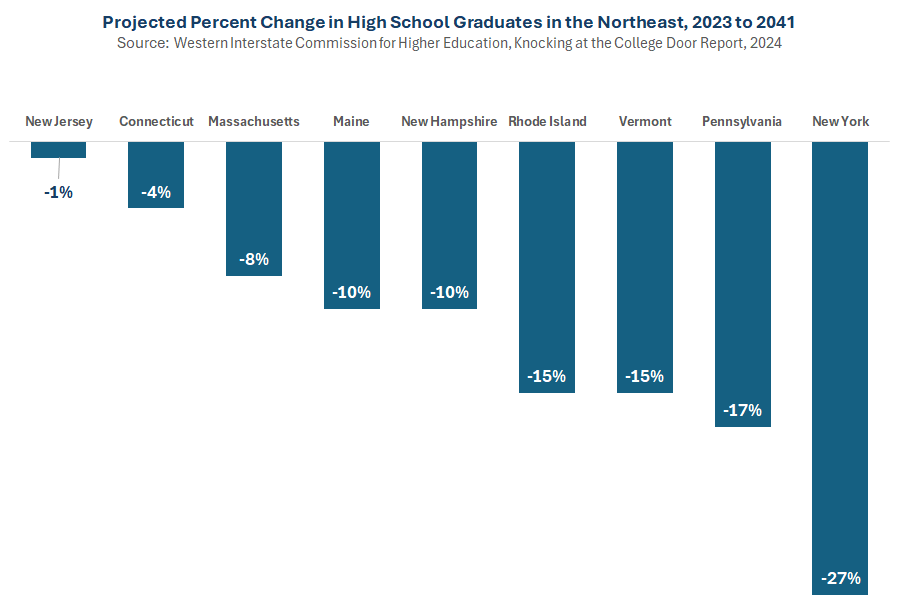
Projected Change in High-School Graduates in the Northeast, 2023-41
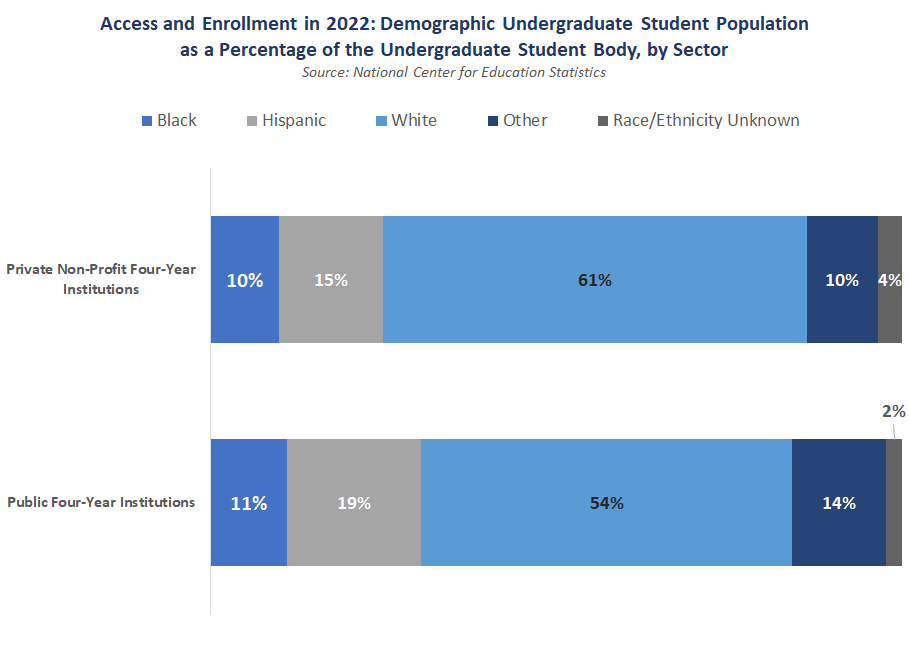
Access and Enrollment in 2022: Demographic Undergraduate Student Population as a Percentage of the Undergraduate Student Body, by Sector
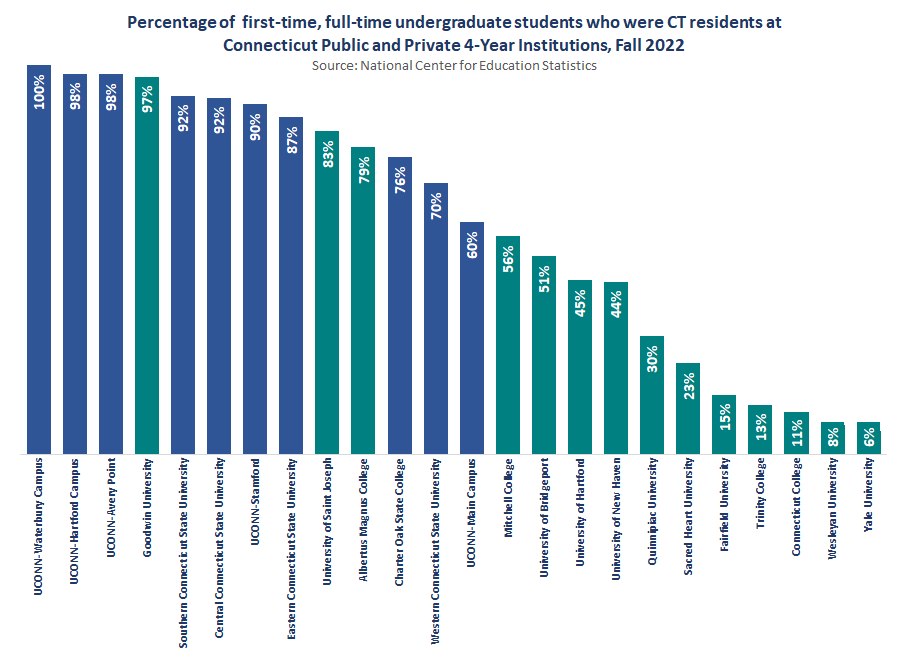
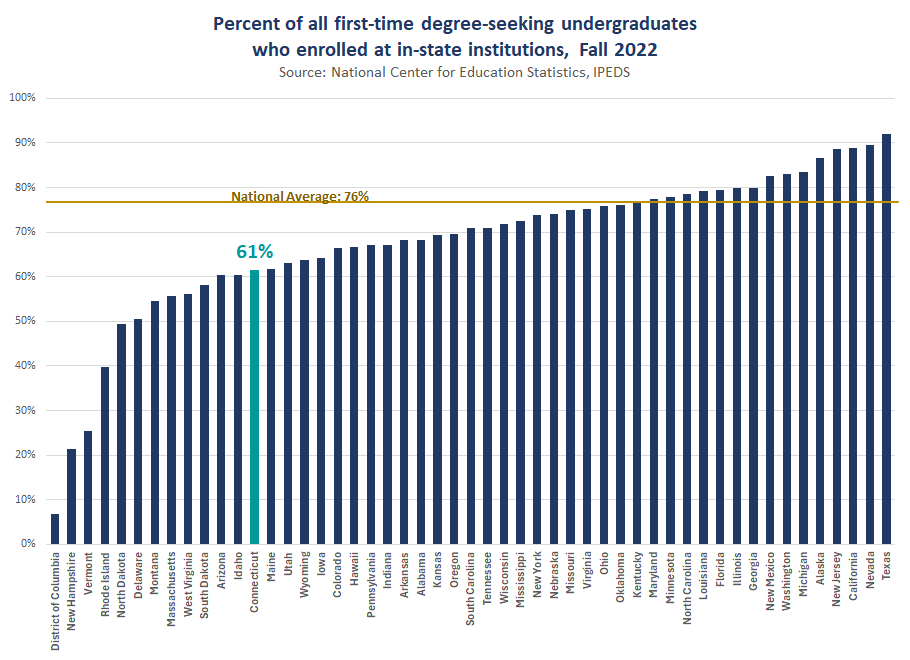
Percentage of first-time, full-time undergraduate students who were CT residents at Connecticut Public and Private Institutions, Fall 2022
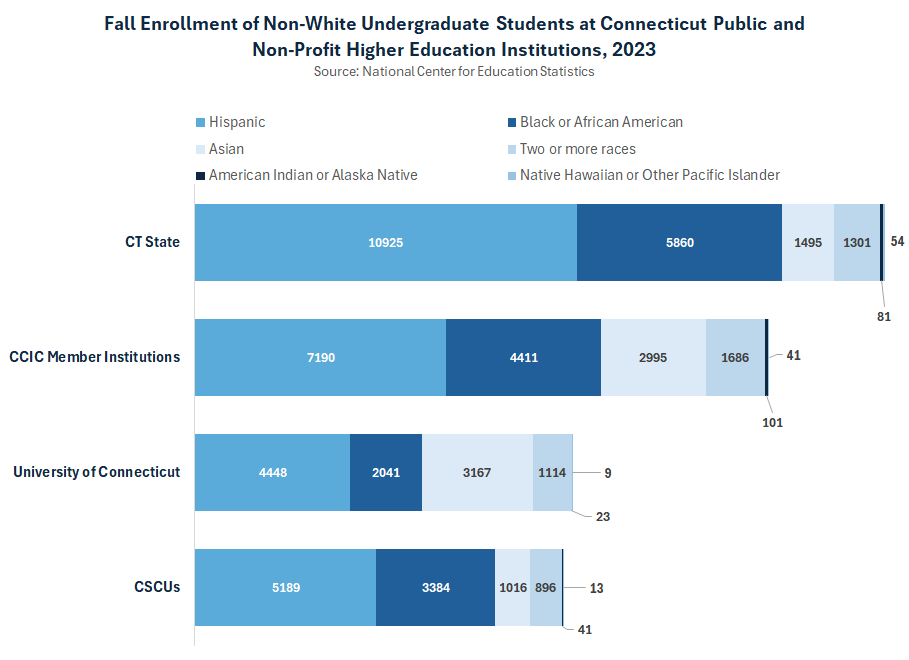
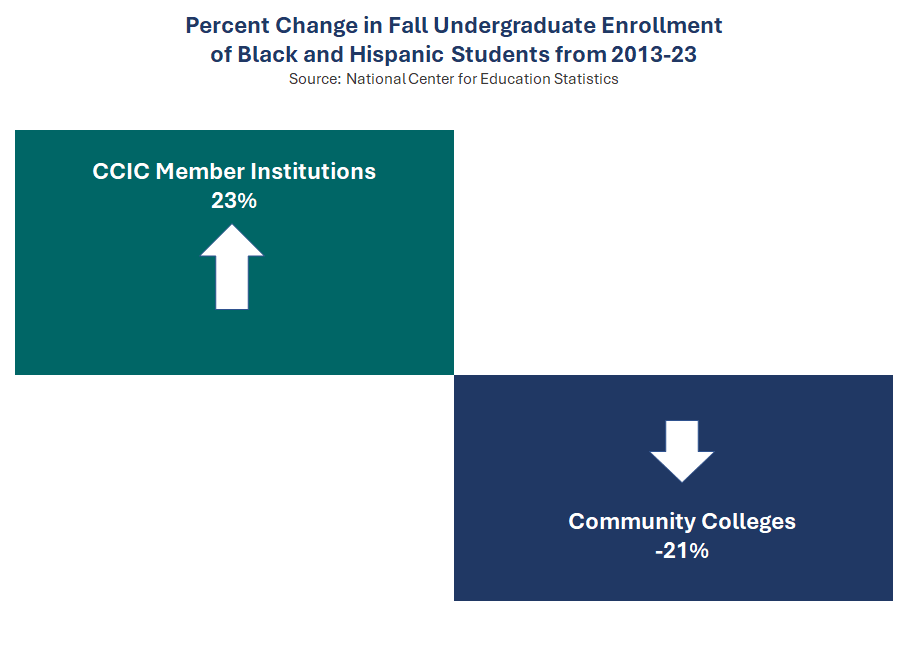
Fall Enrollment of Non-White Undergraduate Students at Connecticut Public and Non-Profit Higher Education Institutions, 2023
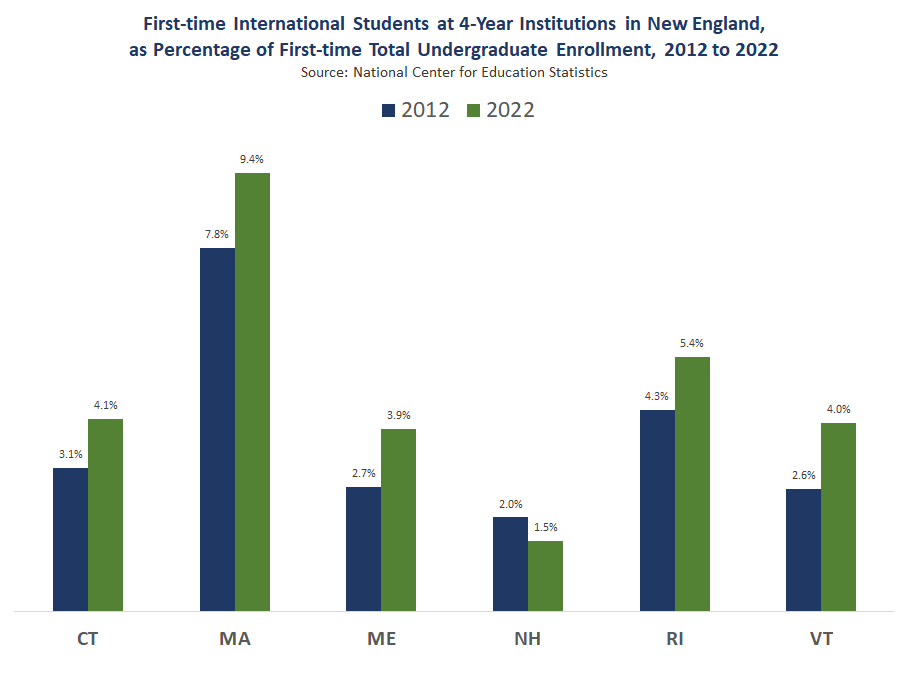
Enrollment Change of International Students in New England from 2012 to 2022
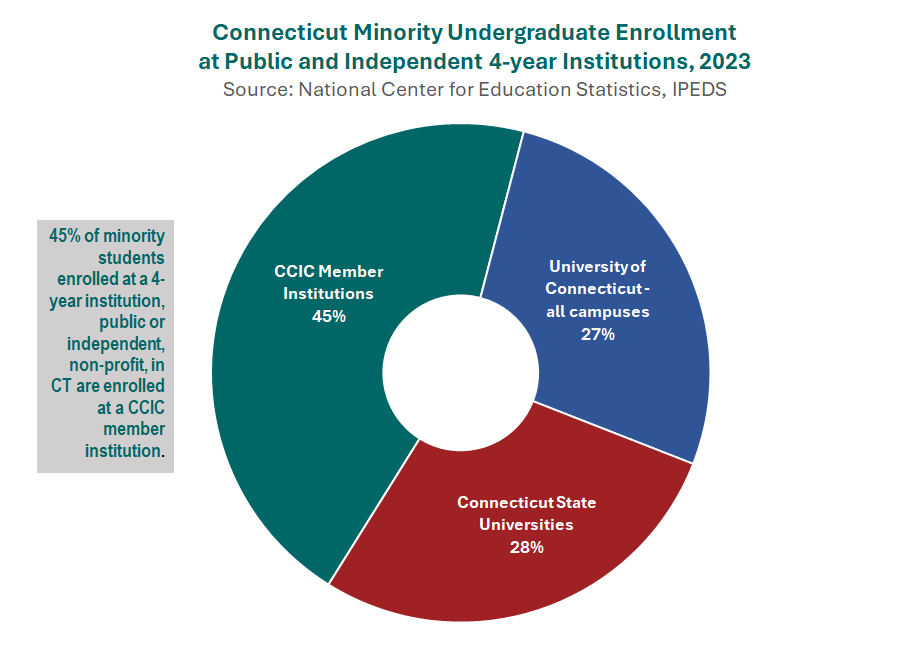
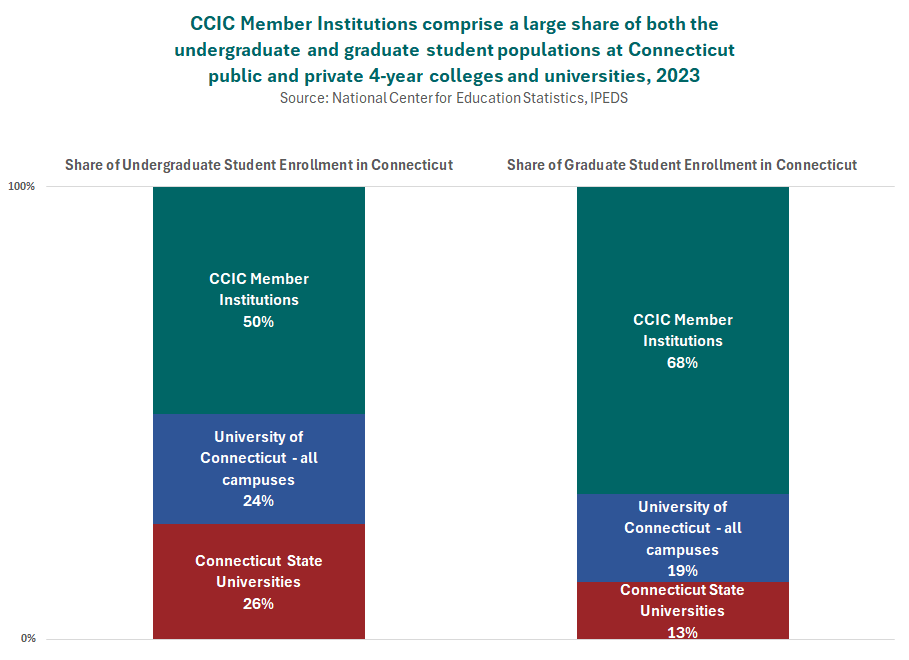
Connecticut Minority Undergraduate Enrollment at 4-year Institutions, 2023: 45% of minority students enrolled in a 4-year public or private, non-profit undergraduate institution in CT are enrolled at a CCIC member institution.
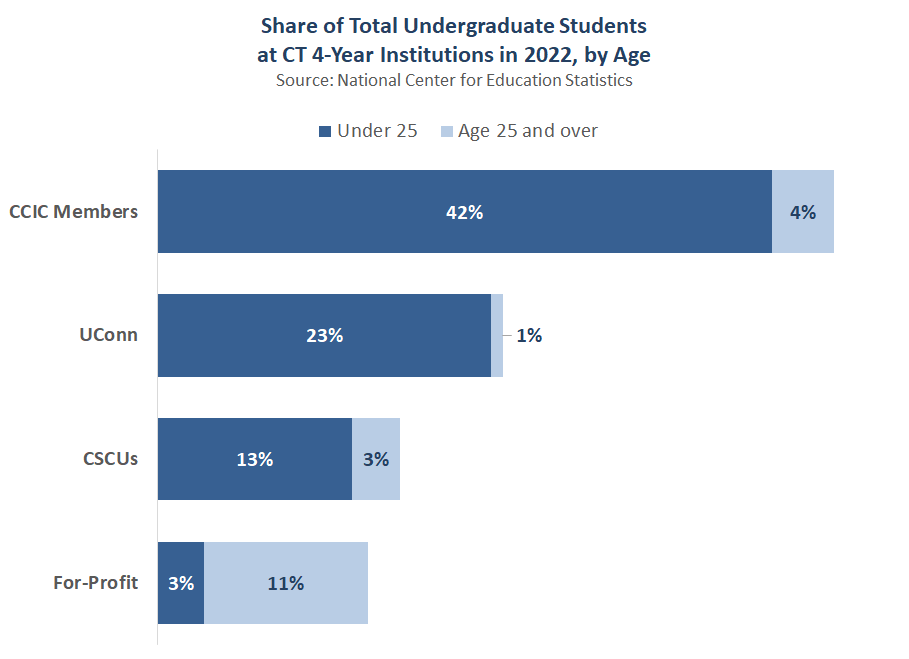
Share of Total Undergraduate Students at CT 4-Year Institutions in 2022, by Age